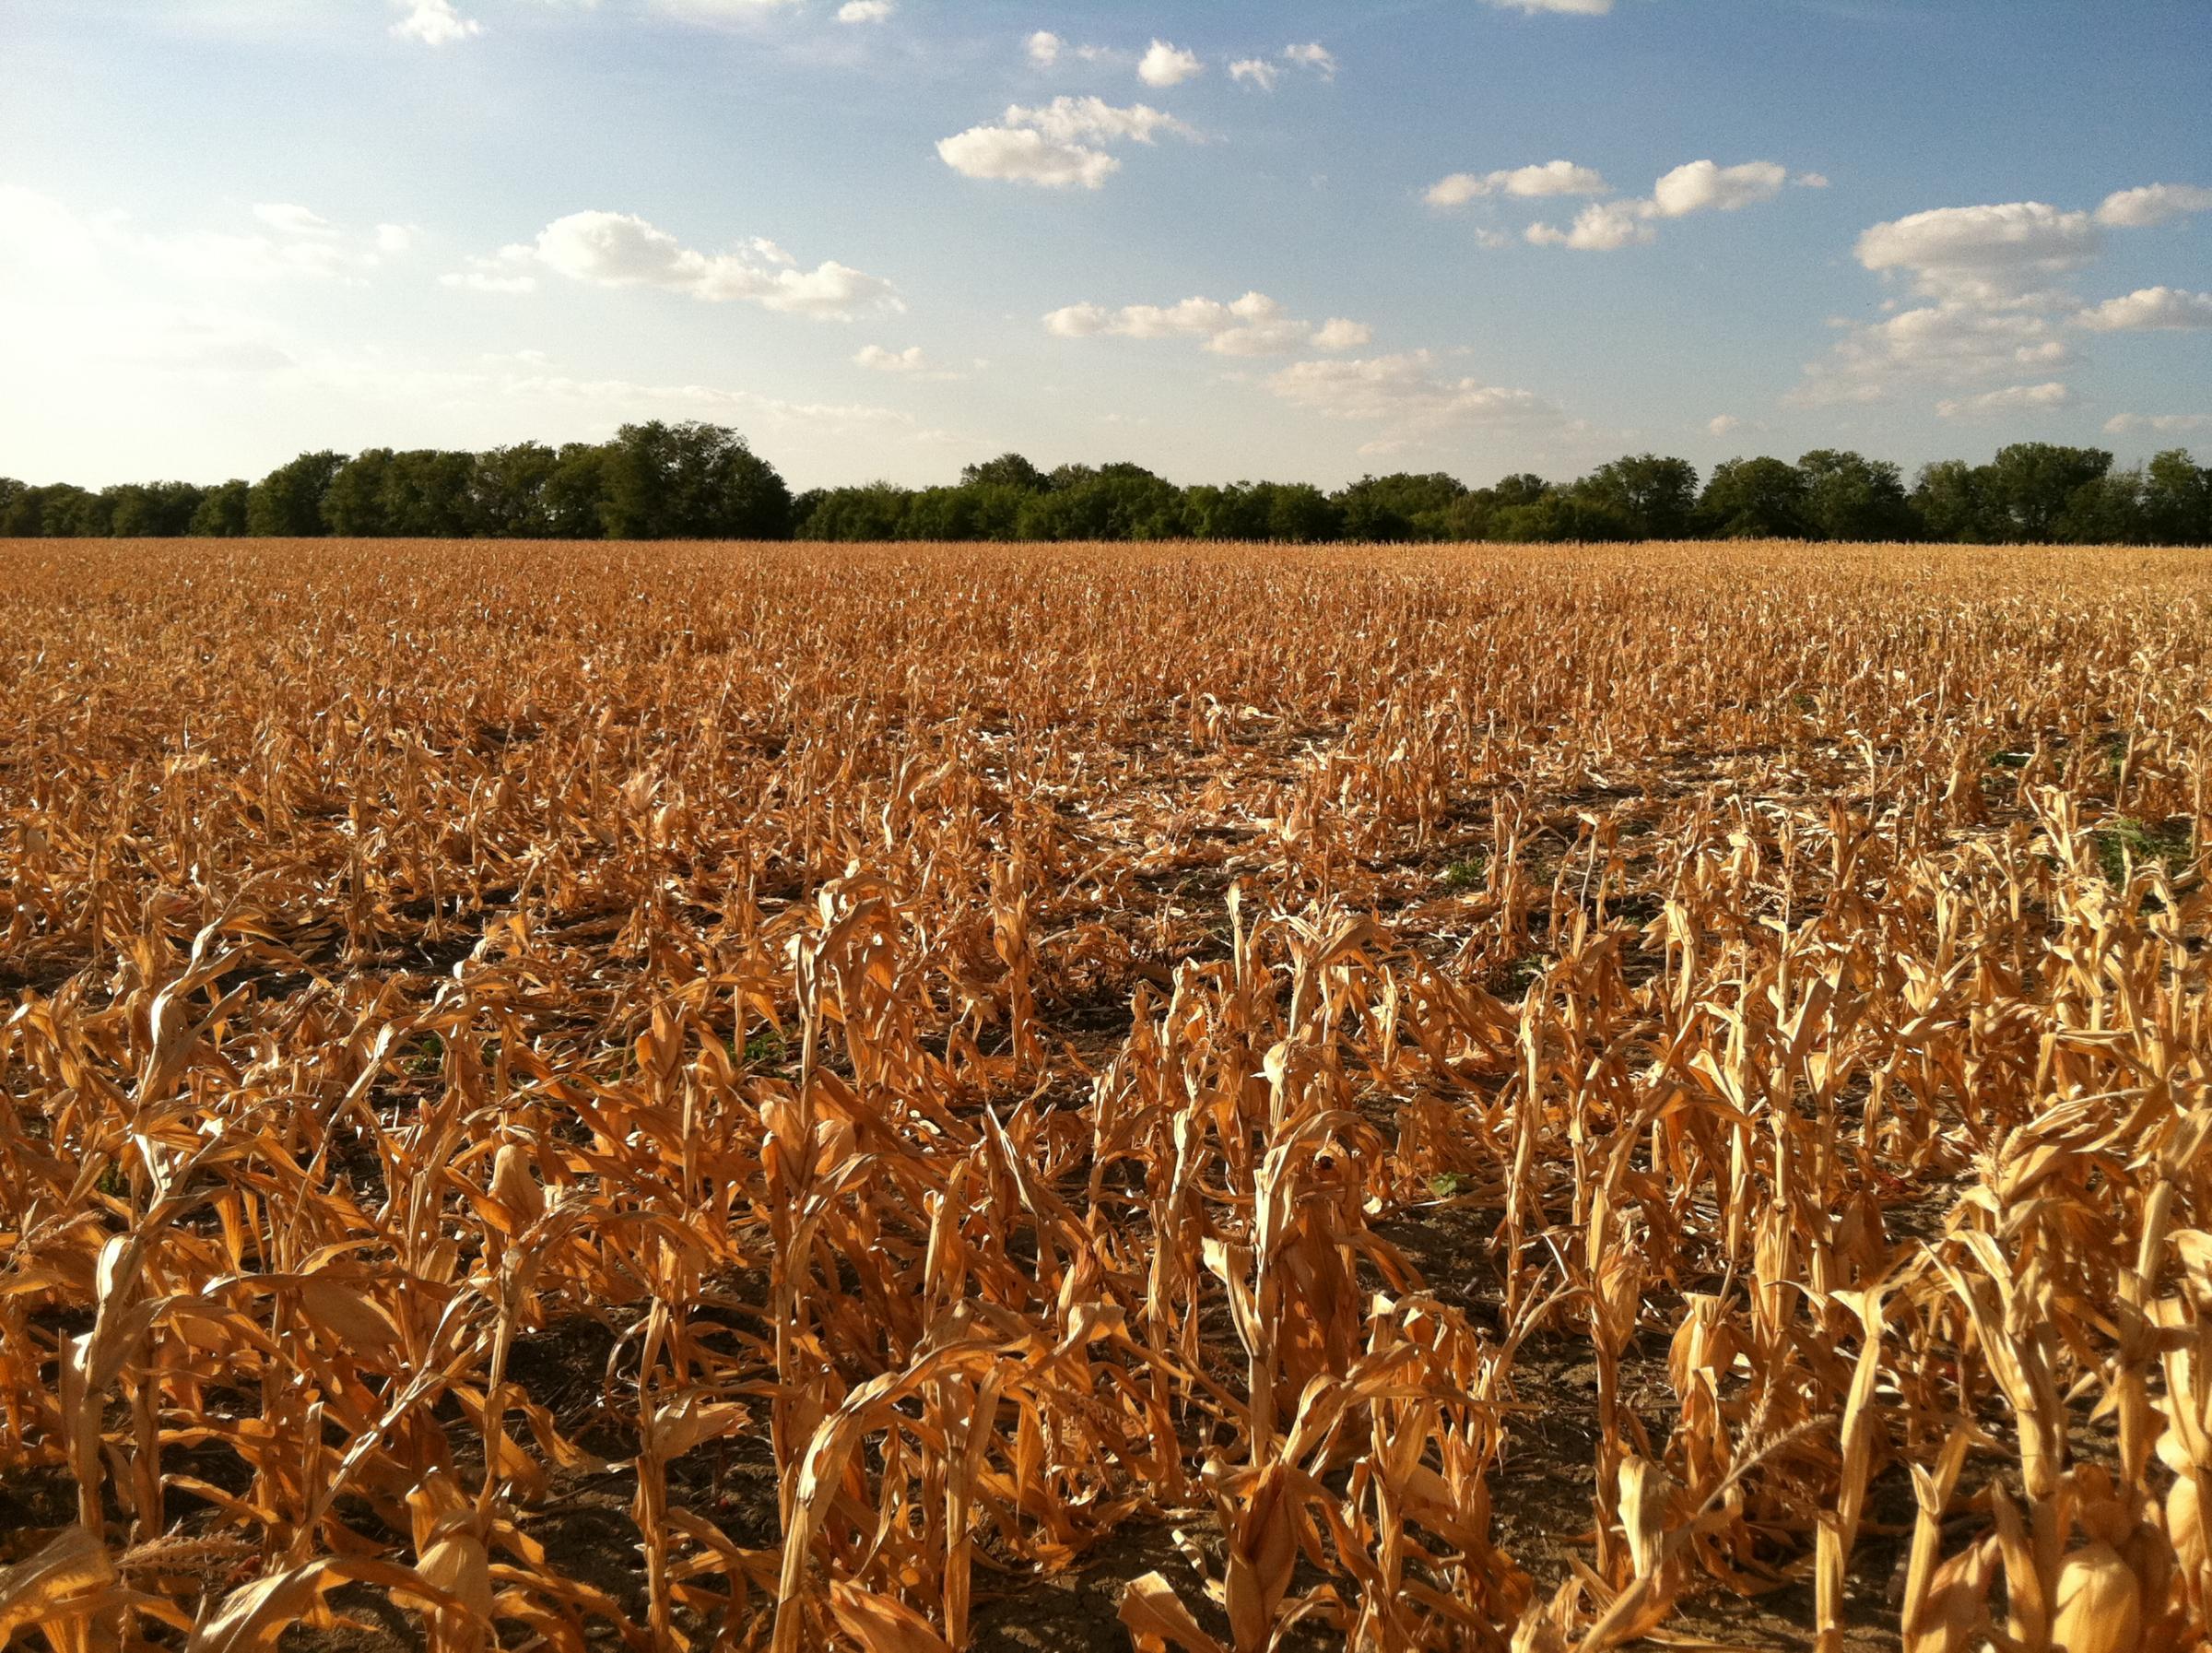
As dryness intensifies across state, Missourians encouraged to submit drought reports

COLUMBIA, Mo. — Dry conditions continue to intensify across Missouri, especially the southern half of the state, according to the June 30 U.S. Drought Monitor map.
“June was overall a hotter-than-average-month for Missouri, averaging about 2 degrees above normal, and it was also a dry month for most locations,” said Pat Guinan, University of Missouri Extension state climatologist.
Parts of central and southern Missouri have received less than 0.50 inches of rain since early June. Impacts are notable, with brown lawns and stressed crops, gardens and pastures, Guinan said. Pond levels are also dropping with little rainfall and high evaporation rates. Without significant and widespread rainfalls, conditions will continue to quickly deteriorate, especially with extreme heat forecast to return, he said.
While rain over the Fourth of July weekend would disrupt holiday plans, Guinan hopes the predicted precipitation materializes. “Because it’s so dry, we’ll take it whenever we can get it,” he said.
The public is invited to submit information to help local, state and national decision-makers assess drought conditions and impacts in Missouri, Guinan said. You may submit information about conditions in your area to a national survey called Condition Monitoring Observer Reports (CMOR). Go to go.unl.edu/CMOR_drought to submit a report.
The survey is for reporting conditions and impacts within the U.S. and its territories. You can directly access the CMOR map at Drought Condition Monitoring Observations and Reports 2022.
“The survey and map will be helpful when it comes to assessing drought conditions and compiling impact reports at the local, county and state level,” Guinan said.
The survey also lets users submit information on extreme conditions and everything in between, from severely dry to severely wet. Input from Missourians helps decision-makers gain a more complete portrayal of drought and flood conditions affecting the Show-Me State, he said.
A related resource is the U.S. Drought Monitor (droughtmonitor.unl.edu), a weekly map showing the location and intensity of drought in the U.S. The map is primarily based on objective measurements such as climatic, hydrologic and soil conditions, as well as reported impacts and observations from hundreds of contributors across the country, Guinan said.
Drought Monitor authors assess data and impact information and use their best judgment to create the weekly drought map, he said. Drought reports from the survey are available to the public and archived for future use.
“I encourage your participation,” Guinan said. “Nobody knows a drought and its impacts better than a person living in the affected area. Your local input and expertise are valued and provide additional information on how drought affects your area.”
Contributors can upload image files less than 10 MB in size. “Pictures are extremely helpful,” Guinan said. “When it comes to assessing drought at the local level, a picture is worth a thousand words.”
The survey was developed by the National Drought Mitigation Center, based at the University of Nebraska, in partnership with the National Integrated Drought Information System.
Miss Clipping Out Stories to Save for Later?
Click the Purchase Story button below to order a print of this story. We will print it for you on matte photo paper to keep forever.

